PTI Index

Residential Market
In the first half of 2024, Mumbai saw the launch of 17,514 residential units1. The mid-segment properties dominated with a 67% share, while the high-end segment contributed 20%, showing a 40% growth compared to the average of the past four quarters1. Rental values exhibited a 5-6% growth over the last quarter, and capital values increased by 3-6% across all submarkets1.
Commercial Market
The gross leasing volume (GLV) for office spaces in Mumbai was 4.78 million square feet (MSF) in Q2 2024, a 75% increase compared to Q2 20231. The suburban markets drove the majority of this leasing activity1. Net absorption stood at 1.72 MSF, a 2.3x increase from Q2 20231.


Retail Market
Mumbai witnessed 132,900 square feet of leasing in grade-A malls, with the fashion segment dominating at 40%1. The city-wide mall vacancy rate dipped to 7.62%1. Prominent main streets saw sustained leasing activity of 71,200 square feet, driven by the fashion segment1.
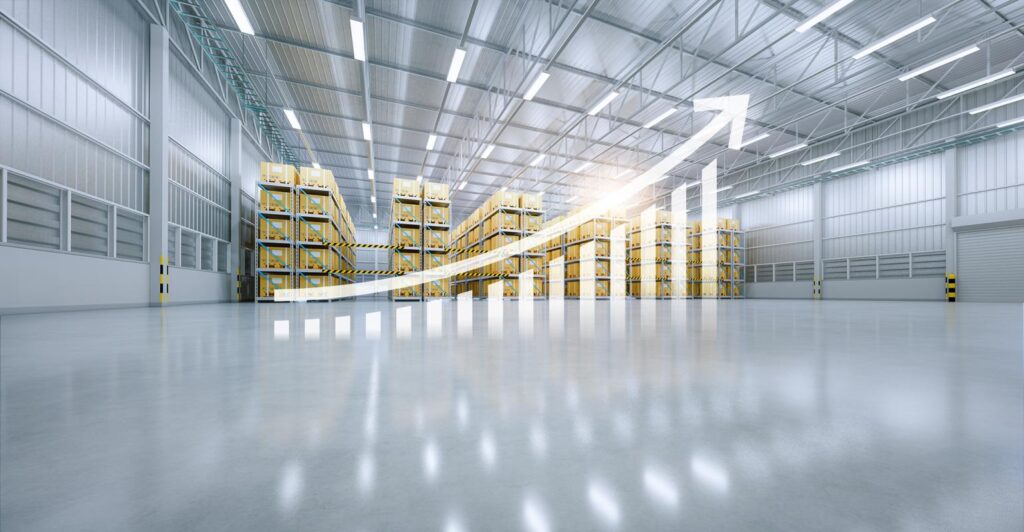
Industrial Market
The warehousing sector saw leasing activity of approximately 2.87 MSF in H1 2024, with the Bhiwandi submarket dominating with a 98% share1. The 3PL (third-party logistics) sector led with more than 65% of deals1. These trends indicate a robust growth across various segments of Mumbai’s real estate market, driven by infrastructure progress and increased demand.